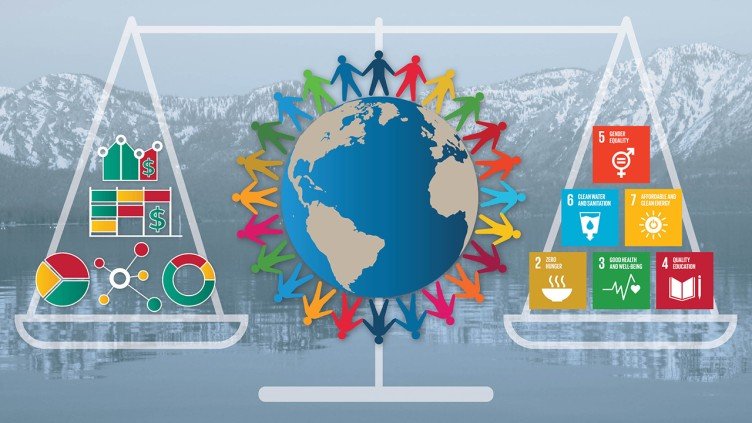
The G20 Development Ministerial meeting on 12 June, 2023 in Varanasi, adopted a seven-year action plan to accelerate progress on the UN Sustainable Development Goals (SDG). Under the theme, “One Earth, One Family, One Future”, the meeting acknowledged that recent crises and challenges have reversed years of progress on the SDG and reaffirmed their commitment to the full and effective implementation of the 2030 agenda for achievement of the goals.
The SDG provides a shared aspirational blueprint for achieving prosperity for all nations and a sustainable future for the planet. The goals recognize that ensuring economic prosperity and preserving the environment starts with removing inequities, creating opportunities, and ensuring that basic needs like food, health and education are available to all. The meeting reiterated the commitment of G20 nations to put sustainable development at the center of international cooperation with a focus on the Global South.
A measure of the economic activity of a nation is its GDP. The GDP is a universally accepted statistic that is representative of the economic health of a country. However, a singular focus on GDP has obscured social, ecological, and environmental dimensions of wellbeing. The GDP, when supplemented with SDG metrics can provide a more comprehensive view of a country’s economic, social, and ecological progress.
The challenge lies in identifying appropriate actionable SDG metrics that can track progress, identify gaps, drive actionable insights, and simultaneously provide a standard way to baseline and compare status across regions and nations. Different methods and models have been used to measure and compare SDG status for regions and countries and their respective distance to 2030 targets. It has been documented that there are large discrepancies between these methods and countries can receive substantially different evaluations depending on the model chosen. These discrepancies are a result of the lack of established standards for a number of the SDG indicators. Even where standards exist, availability, accuracy, and currency of data is still an issue.
Countries of the Global South have been traditionally data poor. Many countries make do with data from censuses that are more than a decade old, some supplementing with data from periodic randomized surveys. There is an urgent need for data that is authoritative, accurate, and timely.
Addressing the Data Gap
In 2014, Myanmar’s census, the first in three decades, revealed that it had 9 million less people than estimated. The government’s estimate of the population was a little over 60 million. The last census was done in 1983 and the country estimated a 2% population growth rate by projecting from the census numbers from 1973 and 1983. The 2014 census established the population as 51 million. Government policies and social investments were made for years based on estimates that were off by almost 20%.
In 2014, Nigeria became the largest economy in Africa overnight. Nothing had changed on the ground, the people were not any wealthier; it was a statistical miracle. The government simply changed the way it calculated GDP. It took into account more attributes and changed weights in a formula that had been left untouched for decades. This method called rebasing is something that should have been done every few years but Nigeria had not changed the weights since 1990.
This is the reality of most countries of the Global South. Censuses are expensive and policies often rely on extrapolating data that is decades old. Randomized surveys are often used to fill in data gaps. These surveys keep sample sizes small to manage costs and tend to be statistically last-mile inaccurate. Many National Statistics Offices face funding challenges in upgrading IT systems, for capacity building, and data up-skilling.
To address these issues, we introduced the facility-based data model [1] to provide a universal and consistent way to baseline and measure progress towards SDG 2030 targets. Facility-based data collection is inexpensive when compared to household enumeration as done in censuses and last-mile accurate when compared to randomized surveys.
Facility-Based Data Model
Facility-based data collection involves enumerating facilities of interest, visiting the facility, and periodically collecting data on service availability, service capacity, and service readiness. To establish a baseline for SDG 2 (Food for All), SDG 3 (Health for All) and SDG 4 (Education for All), data about the presence and distribution of food distribution facilities, health facilities, and educational facilities and the capacity and availability of services was collected. For health facilities, data was collected about health services offered, and capacity in terms of beds, doctors, nurses, etc. For educational facilities, questions were asked about online options, and the number of classrooms, teachers, students, etc. The survey also included questions about access to power, access to water and sanitation, and the gender mix of employees.
The SDGs are highly correlated and modeling the data and dynamics between them correctly can provide insights into what can work across regions and countries. We show that facility-based data collection can provide a simple and effective model to create a baseline for SDGs and a process for periodic data collection can measure and track progress towards the goals. Data at regional levels can be aggregated at country levels to track a country’s progress.
Census data provides a snapshot of each person living in a country and the aggregated data is used to distribute funding and allocate resources across localities and communities. Census data reveals demand-side data and can highlight at-risk areas and socially vulnerable populations. Facility-based data focuses on supply-side data, which when layered with census data can highlight gaps between demand and supply and provide insights into addressing them by either scaling existing capacity or building new capacity and services.
The data associated with a particular facility can be grouped into three types – base, static and dynamic. The type of data determines how it is collected and at what frequency.
- Base Data Attributes– These are data attributes that are common to all points of interest. These typically include identity or location information like name, address, zip code, and latitude/longitude. This is a fixed set.
- Static Data Attributes – Static attributes are data that are mostly common to all points of interest with values that change very infrequently. These include a facility’s operating hours, primary water and power source, etc.
- Dynamic Data Attributes – Dynamic attributes are data that are associated with a specific category and facility type and which change over time. These may include current inventory of resources, available capacity of services, number of employees, etc.

Data for Development Framework
Once good and timely data is available, it can be layered with other data sources to baseline, analyze, compare, and create actionable insights into the SDGs. Population and demographic data from the census when merged with periodically updated facility data can provide insights into:
- resource and service gaps, where to introduce new services and which services to scale
- regional service availability, service capacity, and service readiness
- where to direct new investments for maximum impact towards goals
- social impact of investments
The data can be drilled down to local levels and aggregated up to national levels. The figure below shows food distribution facilities in India, their locations and capacities.
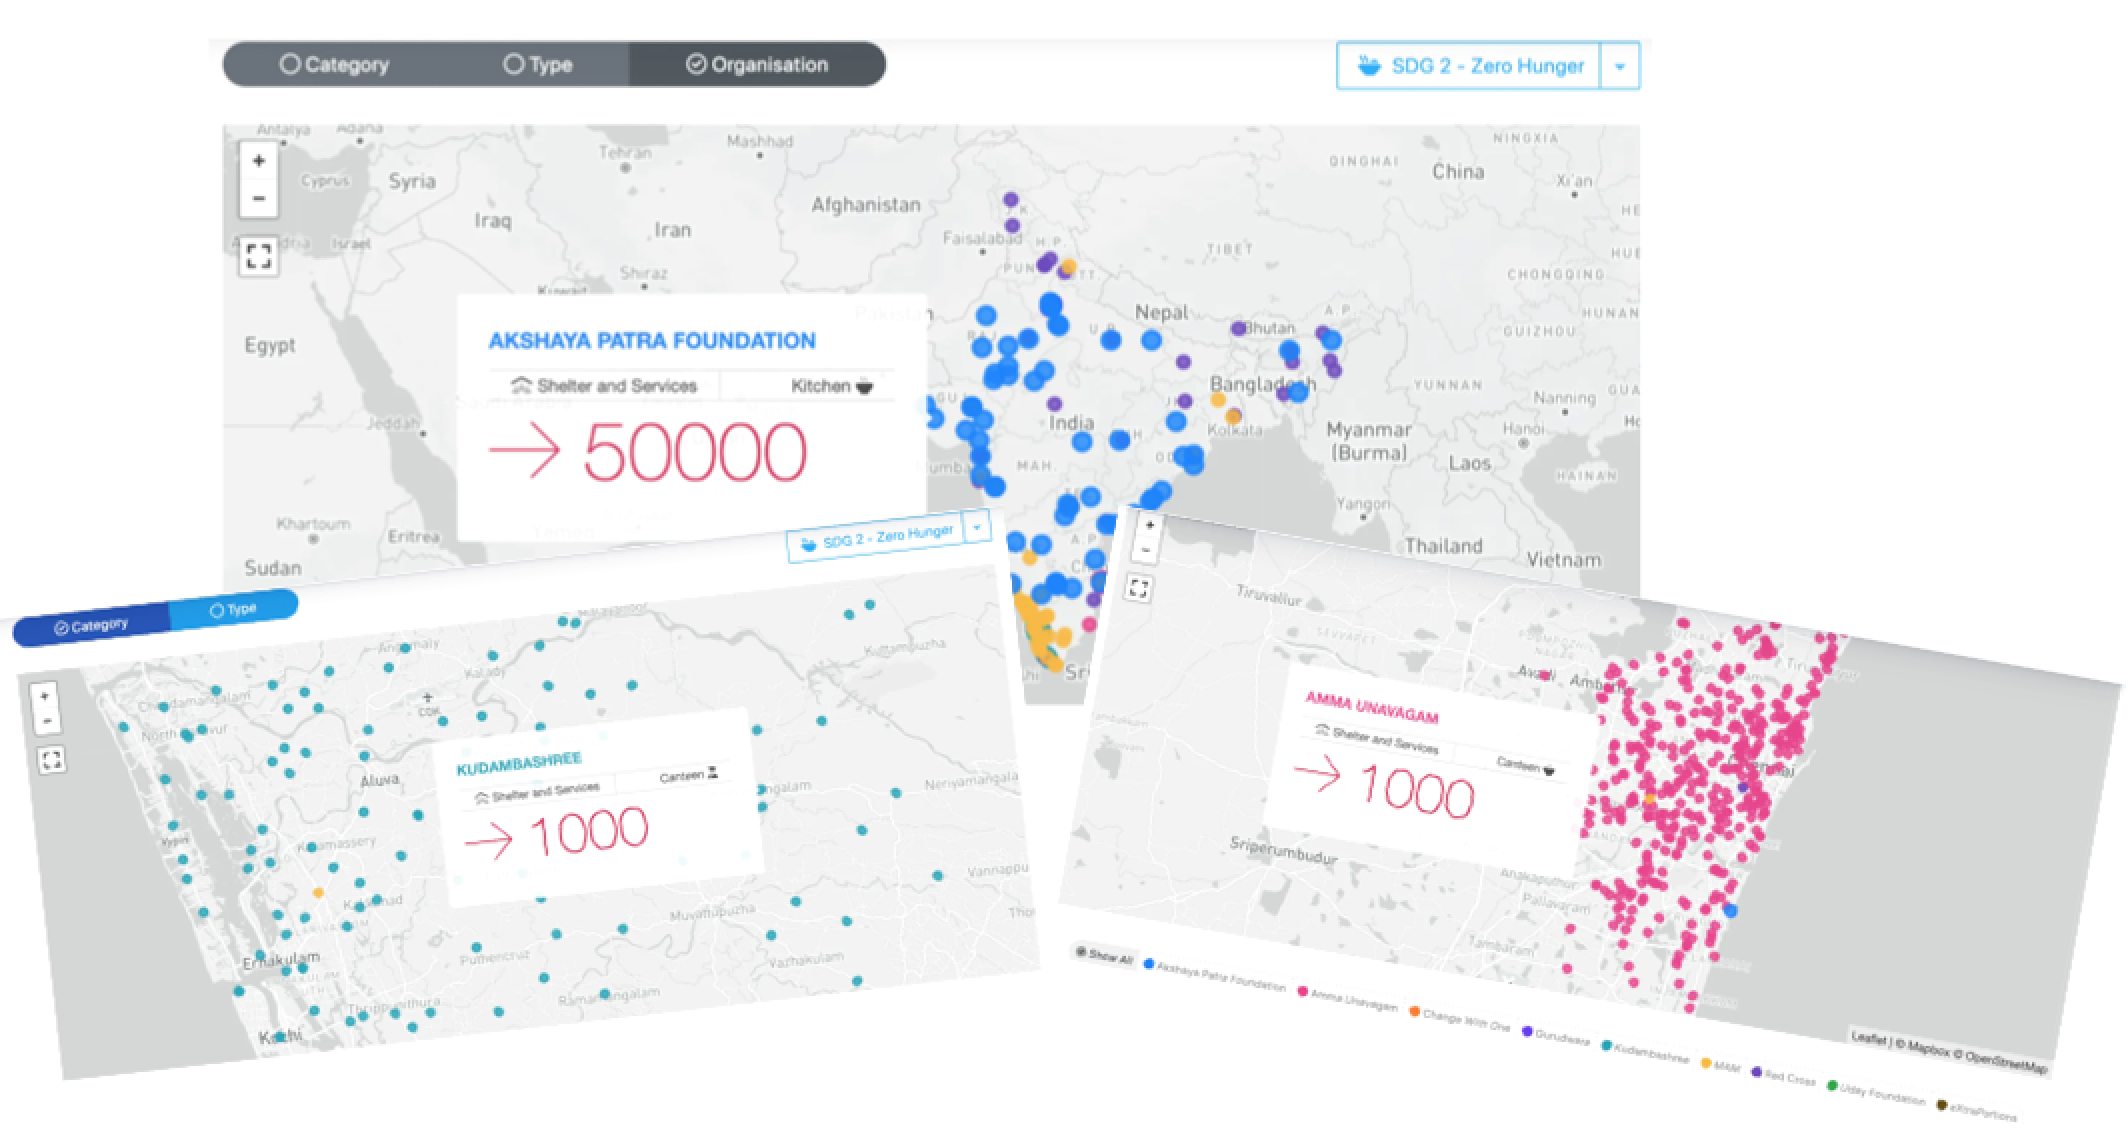
India has a fairly effective food security program through its Public Distribution System outlets. The PDS outlets distribute foodgrains and other commodities at affordable prices and have been effective in managing food inflation and ensuring access to food. During the COVID-19 lockdowns and later, it was recognized that a large number of the population including the homeless, migrant workers, elderly, and other marginalized groups without access to or the ability to utilize a kitchen were excluded from its benefits. Community kitchens are key to providing universal food security. They serve localized, healthy, and inexpensive food, which keeps street food prices in check, extending its benefits beyond the marginalized communities to the daily-wager and the urban poor.
Mapping these facilities and their capacities will provide a key indicator of a community’s resilience in mitigating effects of future epidemics and disasters. A responsive national food grid that provides food security for all is foundational to an ethical and resilient economy.
The Health (SDG 3) and Education (SDG 4) Dashboards provide at-a-glance aggregated data on facilities and resources available in a region. This data when combined with demographic data provides a baseline for SDG 3 and SDG 4 that can be used to track progress and distance to target.
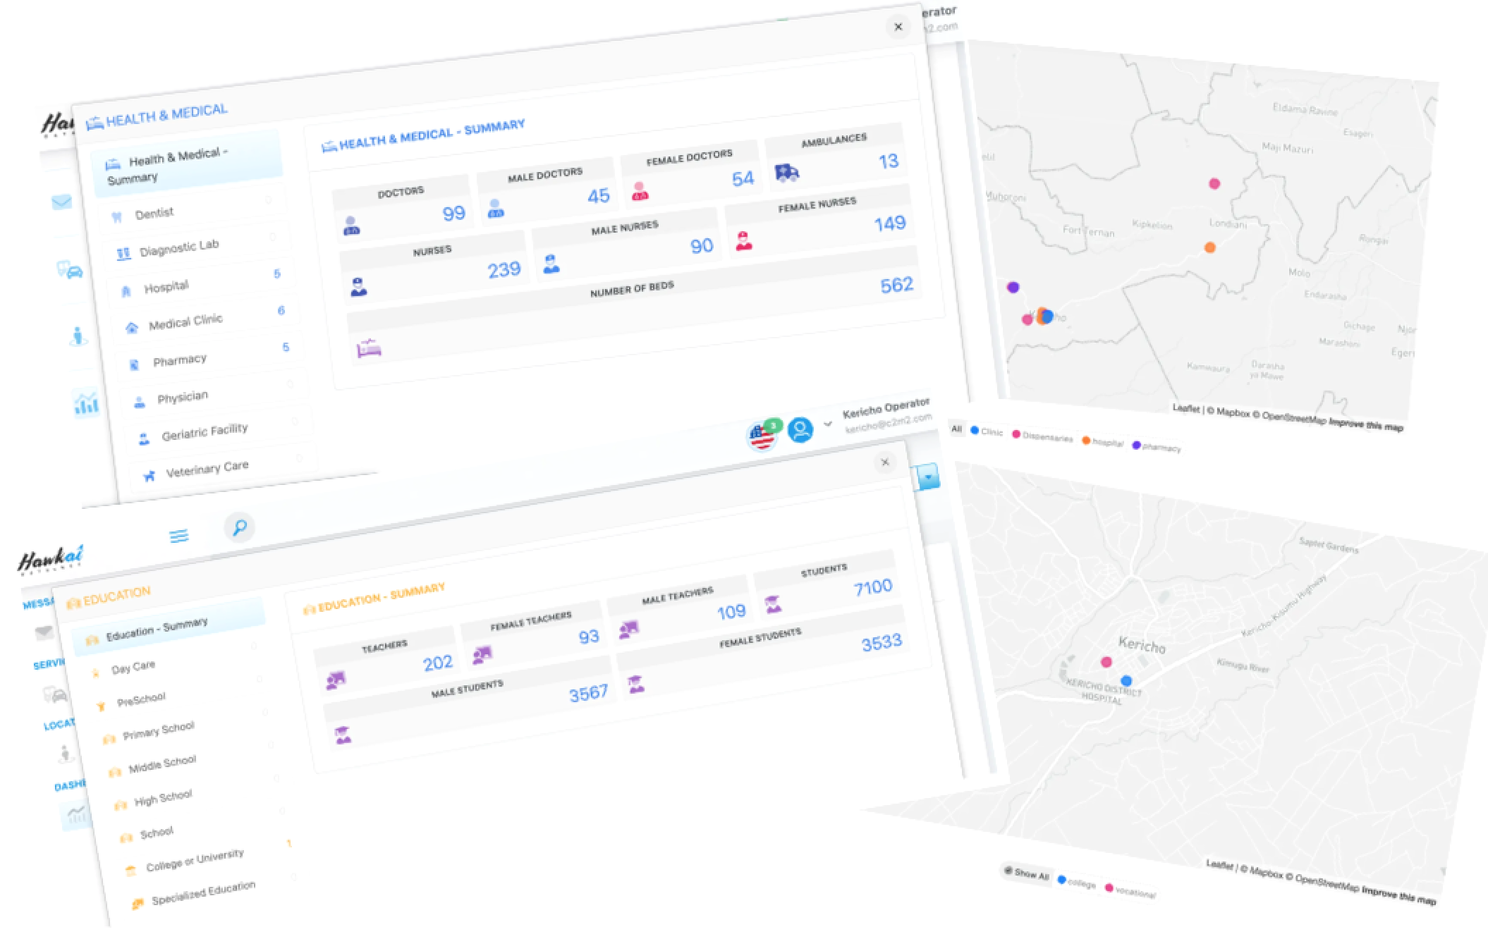
The facility-based model creates updated facility registries that are foundational towards the deployment of digital health public goods [2] that can accelerate the achievement of targets for SDG 3.
For each facility, gender statistic data was collected. For health facilities, data was collected on the gender mix of doctors and nurses. For educational facilities, similar data was collected on teachers and students. This data when layered with census data can be used to provide regional gender statistics in health care and education and to understand gender imbalances in these professions.

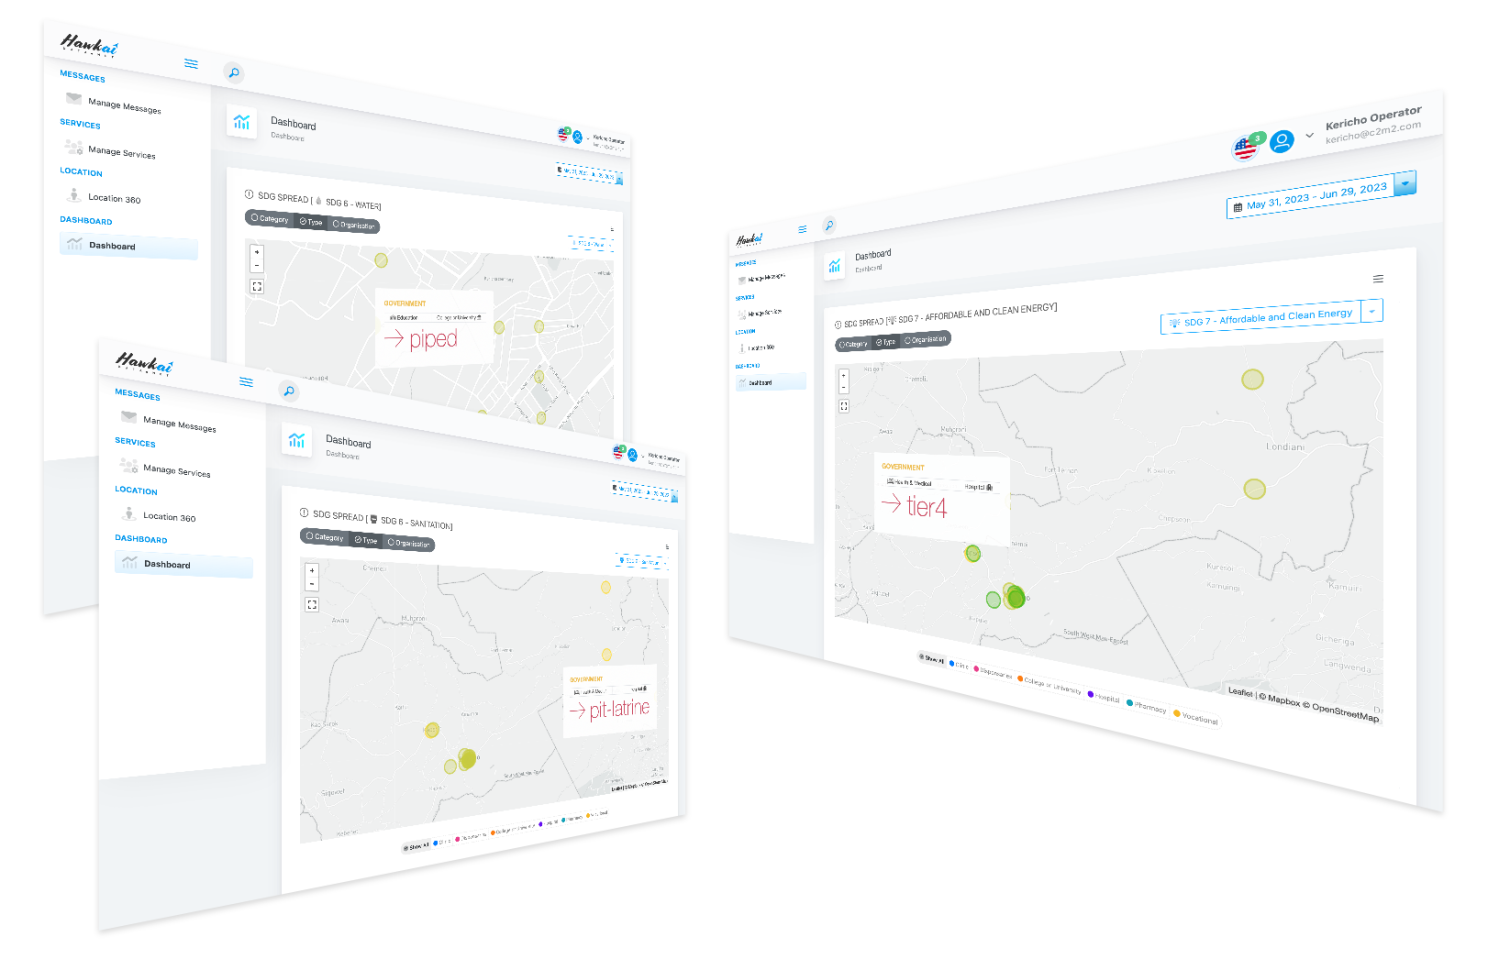
For each facility, data was collected on access to safe water, sanitation, and power. This data allowed us to measure the population that has access to piped water connections, access to improved sanitation facilities, and electricity. SDG 6 and SDG 7 dashboards show interactive maps that track progress towards the goals of access to clean water and sanitation and access to power at local, regional, and national granularities.
People, Planet, Profits, and Policy
Businesses have long focused on unit economic models that measure increases in productivity as keys to success. Automation, operational efficiency, and increased productivity directly impact profits. Their impacts on people and the planet have not received nearly the same attention.
A singular focus on operational efficiency and unit productivity metrics has given us leaded gasoline, CFCs, DDT, PFAS, and plastics. While all have arguably improved the quality of life for many, they have been disastrous to the planet and had a net-negative impact on people as a whole. The growth at any cost mindset and a focus on quarter to quarter financials has led to economic volatility, and for the planet, it has made climatic extremes the new normal. We need to transition from growth at any cost to sustainable growth where profits are balanced with a consideration for people and the planet. Sustainability must move from a business function to the way of doing business. It will create long-term value for the business, for the people, and for the planet.
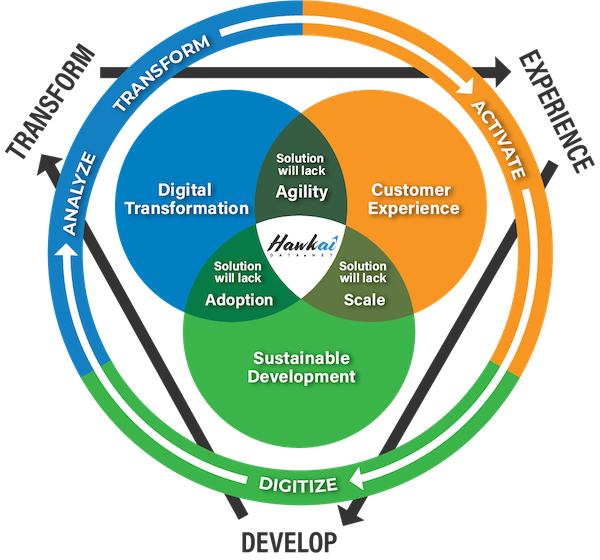
A measure of all the economic activity of a country is the GDP. GDP is an indicator of the economic health of a nation and as a statistic has served us well. Sustainable growth requires us to go beyond GDP to a socio-economic-ecological indicator that represents equitable progress. The facility-based data for development framework will allow social and ecological metrics to be layered with economic metrics. It will balance efficiency with human experience and sustainability.
Countries will need quality data to formulate SDG policies and evaluate progress towards targets. A national data for development infrastructure is foundational to a modern data economy, enabling equity and ensuring that no one is left behind. We need to go beyond GDP as a measure of progress and include social and ecological data. It is time to expand the System of National Accounts (SNA) [3] with new processes to include social and ecological data with economic data.
The data for development infrastructure will allow governments to direct investments to the most vulnerable populations and for donor organizations to quantify how their aid is changing lives. When this data is open and available, and digital access becomes inclusive, it will create resilient communities, improve the lives of citizens, create profitable businesses, and sustainably grow the economy.
Further Reading
[1] Mbonglou G, John R. Data and dashboards for measuring the social impact of COVID-19 in African cities. The Geographies of COVID-19 — Geospatial Stories of the Global COVID-19 Pandemic. Springer;2022;Chapter 11.
[2] John R. The Missing Middle — Towards Universal and Affordable Healthcare. Hawkai Data Blog. Available at https://www.linkedin.com/pulse/missing-middle-towards-universal-affordable-health-coverage-john
[3] UN Department of Economic and Social Affairs. The System of National Accounts (SNA). Available at https://unstats.un.org/unsd/nationalaccount/sna.asp
Hawkai Data provides a Customer eXperience Platform (CXP) to quickly prototype, operationalize, and scale applications and services. Start your digital transformation today and create new business and customer experiences using Hawkai Data CXP.
If you have any questions, talk to us at info@hawkai.net, or follow us on LinkedIn at https://www.linkedin.com/company/hawkai-data/, or connect with us at https://hawkai.net.


