
On a recent trip to Cape Town, South Africa, I realized how frictionless and borderless travel has become. A decade ago, visiting any country required you to exchange your dollars at the airport, and spend the local currency in town. Today, things are digital and cashless, with little need for local currency. You get out of the airport, request a car through Uber, and pay using a credit card.
A decade ago, tourists brought much-needed foreign exchange into a country. Today’s digital and cashless transactions are taking much-needed foreign exchange out of the country. Tourists are still spending money but with every digital transaction is the giant sucking sound of capital flight. Digital and cashless have made things frictionless and borderless but this convenience comes at a cost.
A 2023 report [1] estimated Uber’s impact on the South African economy to be over R17 billion (around $1 billion). Uber keeps 30% – 50% of the fare depending on the class of transport. Add to this the 2 – 3% transaction fee of the credit card, and the mobile data costs for the Uber app, and the Uber economy by itself leads to a capital flight of over $500 million. As commerce becomes increasingly digital and cashless, countries have to weigh the public benefit against the convenience cost of a frictionless and borderless economy.
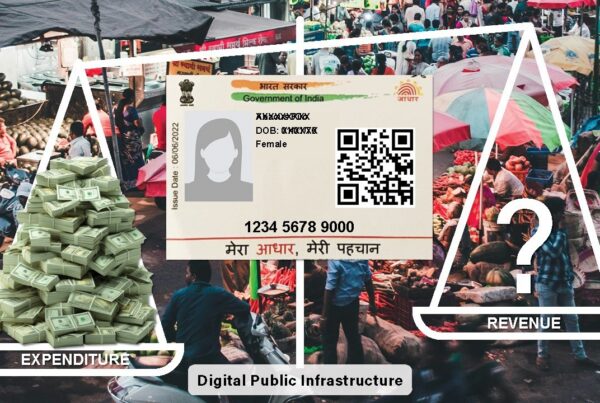
How do countries of the Global South ensure digital sovereignty while still ensuring a digital, cashless, frictionless, borderless, inclusive, and equitable world? How do countries create the digital infrastructure where data can be efficiently consumed, effectively monetized, and ultimately leveraged to serve public good?
Digital Public Infrastructure (DPI) promises data sovereignty empowering countries to harness the full potential of their digital assets. How do countries transform DPI’s promise and potential into performance? Are there lessons that countries of the Global South can take from India’s DPI rollout at scale?
Digital Identity to Data Equity
Africa is data poor. For many countries, censuses were done over two decades ago. The lack of data can lead to misallocation of funds, impede in the fair distribution and delivery of services, and hinder the ability to target aid to those most in need.
India’s last census was done in 2010. The data from India’s digital ID solution, Aadhaar, filled in the gaps. Aadhaar was about identity, but more about data. Aadhaar data was key to identifying duplicate, fake, and ineligible beneficiaries. It also provided last-mile accurate data on the geographical distribution of population, age, and gender demographics. Additional mining of data could reveal insights into household sizes, housing availability, and identify areas with the most underserved populations.
An ID allows citizens to access services; the data collected when converted into actionable insights enables policymakers to determine where services are needed, create locally tailored solutions, and direct resources to areas and families in greatest need.
SDG 16.9 aims to provide legal identity for all, including birth registration, by 2030. While most countries have mechanisms in place to register births, systematic recording remains a significant challenge, and over 150 million under the age of 5 remain unregistered. In an increasingly digital world, 150 million children do not exist, making them invisible to government programs. This lack of identity leaves children vulnerable and without easy access to basic services like healthcare and education.
Aadhaar did bring positive change. It made millions visible to the state. Aadhaar biometrics allowed the tracking of thousands of missing children. Aadhaar digital APIs for verifying identity significantly reduced customer acquisition costs. It exposed gaps, identified underserved populations, and substantially curbed the misallocation of funds.
India’s digital identity mission delivered data equity. However, it also exposed physical inequity. An ID enables frictionless access to services, but an ID matters little when the services themselves are not available or accessible.
Doorstep Banking to Physical Equity
In 2014, India launched the National Mission for Financial Inclusion known as the Jan Dhan Yojana. Instead of people going to the banks, the banks came to the people. With the banks came electricity to power the equipment and homes, clean water and sanitation, roads to transport goods, access to essential services like healthcare and education, and schools to skill youth to access and operate the digital future.
A facilities registry [2] is an indicator of physical equity. The facilities registry, when overlaid with the demographic data highlights gaps and the physical divide. The Jan Dhan Yojana was successful because good data was available; informing where underserved populations were, where infrastructure gaps were, and what investments were needed to address the gaps. Physical equity is ensuring that brick-and-mortar facilities are available and accessible to all. Physical facilities include schools, hospitals, roads, access to power, water and sanitation, sewage treatment plants, data centers. Physical equity is contingent upon a skilled workforce and institutional capacity-building capabilities. It is conditioned on data equity.
In 2016, India launched the Universal Payments Interface (UPI). UPI’s QR code-based merchant payment did not require powered POS terminals or a private secure data network. This enabled hundreds of millions of merchants, small businesses, and service providers to accept electronic payments directly into their linked bank accounts, significantly reducing the need for cash and paper receipts.
Over 800 billion credit and debit card transactions happen every year. This translates to an annual electricity consumption of 1.18 terrawatt-hours [3]. The penetration of POS terminals is limited in large parts of the Global South. As marketplace transactions in these areas become increasingly digital, the volume of credit/debit transactions will significantly contribute to the carbon footprint. UPI is a greener and more sustainable option for digital payments. It allowed no-cash marketplaces to flourish and is enabling India’s transition to a formal economy.
In FY 2024, India transacted over $3.0 trillion in UPI transactions. Unlike credit card transactions, UPI does not involve a third-party intermediary. UPI transactions are direct bank-to-bank transfers and don’t incur transaction fees. In FY 2024, UPI saved businesses over $70 billion in credit card merchant transaction fees and about 275 megawatt-hours of power. For comparison, the total revenue estimate from Global Competency Centers (GCCs) in India is estimated at $65 billion [4].
Data equity and physical equity ensured a more sustainable and formalized economy. However, it also exposed digital inequity. Digital equity requires inclusive, frictionless, and affordable digital access.
Today’s Beneficiary to Tomorrow’s Consumer
Digital identity allowed frictionless access to government services. UPI enabled cashless and frictionless commerce. Widespread adoption of these services, however, was dependent on the affordability of digital access. The figure below illustrates the cost and consumption of mobile data in India over the years.

The average cost per GB went down 10x, from a high of ₹90 (about $1) in 2015 to below ₹9 ($0.1) in 2024. During the same period, the average data usage per month increased over 100x. Foundational to digital equity is affordable data rates. India, today, has the lowest mobile data rates in the world, and Indians are also the highest consumers of data.
The availability of Aadhaar for user authentication and low data rates boosted mobile phone ownership. Today, over 95% of households have a mobile phone. The Jan Dhan Yojana, similarly, boosted the share of households owning a bank account to over 99%. Financial inclusion empowered individuals, boosted businesses, fostered growth, alleviated poverty, and promoted equity. It was also extremely profitable for first-mover companies [5].
Affordable data converted yesterday’s beneficiaries into today’s consumers. Many countries are looking to build their own digital public infrastructure. If there is one lesson that these countries must internalize from the India model, it is that for success, data equity must precede physical equity, and physical equity must precede digital equity.
Emerging Market to Emerging Model
Over last decade, India lifted over 250 million people out of poverty. What made it happen was the fundamental tenet that today’s beneficiary is tomorrow’s paying consumer. Three factors were foundational in making it happen – digital identity, no-fee digital payments, and affordable digital access. Underlying it all, and what made it a success, was quality data.
Data cannot be an afterthought. Success with data requires well-defined data models that ascribe semantics to the data, a continuous process of collecting and updating that ensures the currency of data, and well-defined open data exchange protocols that allow data to flow seamlessly across functional units within an organization and across organizations.
The Account Aggregator (AA) and Open Credit Enablement Network (OCEN) framework will open banking data to facilitate data interchange between regulated financial entities. The AA and OCEN data frameworks will make lending and wealth management faster, cheaper, secure, fairer, and consent-based. The Ayushman Bharat Digital Mission (ABDM) is creating a health facility registry and claims exchange, making transactions cashless, health records portable, and significantly lowering healthcare costs [6]. The Open Network for Digital Commerce (ONDC) is creating a level playing field for small merchants by unbundling supply chains for order fulfillment. The ONDC platform enabled the launch of Bharat Taxi [7], a cooperative-driven mobility option, with a zero-commission fare structure where drivers earn the full amount from each ride.
The India model has demonstrated that success is contingent upon the 4 S’s – Saturation, Stack, Service APIs, and SDG metrics [8]. Saturation ensures that no one is left behind, and early movers among service providers benefit from lower customer acquisition costs, increased customer loyalty, and higher profits. Stack ensures that data is not fragmented but federated, significantly reducing duplication of work and avoiding fragmented analytics. Service APIs increase collaboration, increase citizen and private enterprise engagement, and allow localized solutions with borderless reach. SDG metrics provide a true measure of DPI’s impact, providing clarity and actionable intelligence into gaps and the targeted investments needed to accelerate the achievement of SDGs.
Without saturation, there is exclusion. Without a stack, there is no digital infrastructure. Without service APIs, there is no pathway to access the stack, and what remains are proprietary data silos. Without SDG metrics, there is no way of measuring social impact.
Digital Colonialism to Digital Sovereignty
Foreign aid has driven many countries of the Global South into dependency or debt. Once aid is normalized, self-reliance appears risky. Learnings from India’s success at scale with DPI offers a model to mitigate these risks while charting a path towards digital sovereignty. While it is true that Global South challenges need Global South solutions, it is equally important to recognize that India’s specific approach may not be universally applicable. The first step is for countries to recognize that digital sovereignty is crucial for achieving many of the Sustainable Development Goals (SDGs). Each country must determine their own scope, strategy, and timeline for achieving the goals.
Countries need an actionable framework to provide transparency into underserved geographies and sectors, and to finance and operationalize steps towards meeting SDG targets. This clarity will require quality data, trusted processes, and actionable intelligence. It will require an actionable framework that can baseline and compare status, identify gaps, make targeted investments, and quantify the return on investments. It will require reforming service delivery models, adopting best practices, and continuous and consistent monitoring of progress toward the goals.
The Metraa (Measure/Track/Reform/Accelerate/Achieve) framework [9] leverages open data, digital transformation, digital public infrastructure, and sustainable models of service delivery. The Metraa framework will provide transparency into progress towards goals and an accelerated path towards achieving them. It will foster collaborations and partnerships, boost local entrepreneurship, and put countries on a path towards sustainable resilience and social equity. The Metraa framework will enable countries chart their own unique, measurable, and predictable paths towards digital sovereignty and achieving SDGs. It will create resilient communities, responsive governments, and a sustainable planet.
References
[1] The Impact of Uber in South Africa Economic Impact Report 2023, available at https://ubersouthafrica.publicfirst.co/
[2] One Earth, One Future – Going Beyond GDP, available at https://hawkai.net/one-earth-one-future-going-beyond-gdp/
[3] Digital Transformation Guaranteed, available at https://hawkai.net/digital-transformation-guaranteed/
[4] India GCC Landscape Report – The 5 Year Journey, available at https://nasscom.in/knowledge-center/publications/india-gcc-landscape-report-5-year-journey
[5] The DPI Playbook – Data First, not Digital First, available at https://hawkai.net/the-dpi-playbook-data-first-not-digital-first/
[6] Delay, Deny, Deduct, available at https://hawkai.net/delay-deny-deduct/
[7] Bharat Taxi India’s First Co-operative Taxi Service, available at https://bharattaxiapp.com/
[8] Exporting Data, Importing Intelligence, available at https://hawkai.net/exporting-data-importing-intelligence/
[9] Achieving SDGs – An Actionable Framework, available at https://hawkai.net/achieving-sdgs-an-actionable-framework/
Data Sources
Aadhaar – UIDAI data is available at https://uidai.gov.in/en/media-resources/uidai-documents/annual-reports.html
Jan Dhan Yojana – PMJDY data is available at https://pmjdy.gov.in/statewise-statistics
Telecom Regulatory Authority of India – TRAI data is available at https://www.trai.gov.in/release-publication/reports/telecom-subscriptions-reports
Universal Payments Interface (UPI) – NPCI data is available at https://www.npci.org.in/statistics
Learn More
Learn more about Digital Transformation/AI at https://hawkai.net/digital-transformation/
Learn more about Sustainable Development at https://hawkai.net/sustainable-development/
Learn more about building faceless, paperless, cashless, and frictionless customer experiences at https://hawkai.net/customer-experience/
Learn more about Digital Public Infrastructure at https://hawkai.net/digital-public-infrastructure/
If you have any questions, talk to us at info@hawkai.net, or follow us on LinkedIn at https://www.linkedin.com/company/hawkai-data/, or connect with us at https://hawkai.net.